
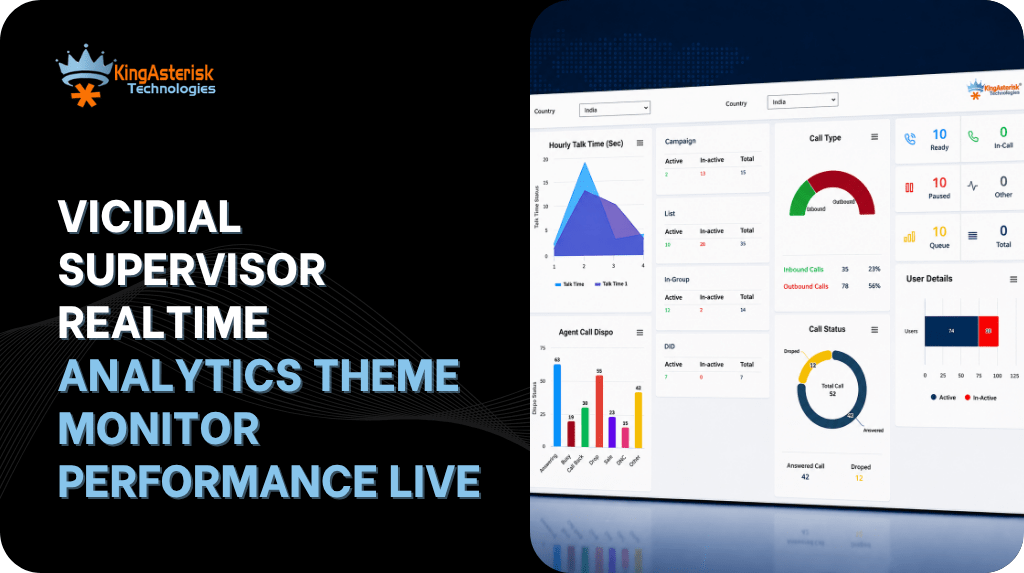
The VICIdial Supervisor Analytics Theme is a purpose-built dashboard that gives contact center supervisors a live, consolidated view of every metric that matters – agent states, wait times, call volume, and queue performance – all updated in real time. For operations teams running busy contact centers on VICIdial, the difference between reacting to a problem after the damage is done and catching it while it is still manageable often comes down to what is on the supervisor’s screen.
This article explains what the theme delivers, how to configure it, and how organisations get the most out of it in daily operations.
The VICIdial admin login screen is the entry point for supervisors and administrators. Access is controlled through VICIdial’s built-in user management, so only authorised personnel reach the analytics dashboard.
What the VICIdial Supervisor Analytics Theme actually does
The standard VICIdial supervisor panel shows data, but its layout was designed around function, not speed of comprehension. A supervisor managing 40 agents across three inbound campaigns has to click through multiple screens to get a complete picture. The analytics theme changes that by pulling all of the same underlying data into a single, high-contrast view that a supervisor can scan in seconds.
The admin dashboard gives a consolidated view of all active campaigns, agent counts, and current queue status. Everything visible here updates without a page refresh, so the data on screen reflects what is happening on the floor right now.
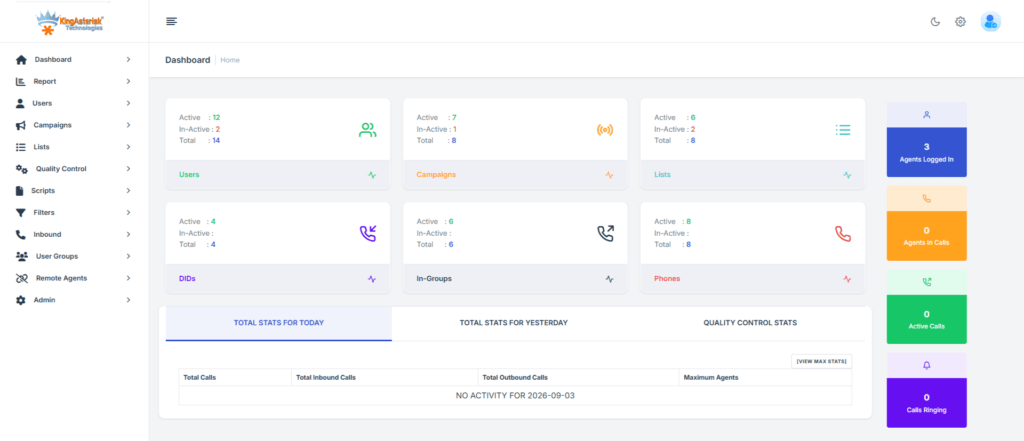
The theme runs in the browser, reads from the VICIdial real-time reporting tables, and refreshes at configurable intervals – typically every two to five seconds. No separate server process is required. The interface is responsive, which means it can run on a dedicated wall-mounted monitor showing the full floor view, or on a supervisor’s secondary screen.
The outcome is not just cosmetic. When the data is easier to read, supervisors make faster decisions. Agents who are stuck on hold get flagged. Queues that are building get spotted before abandonment rates tick upward.
Core metrics displayed on the dashboard
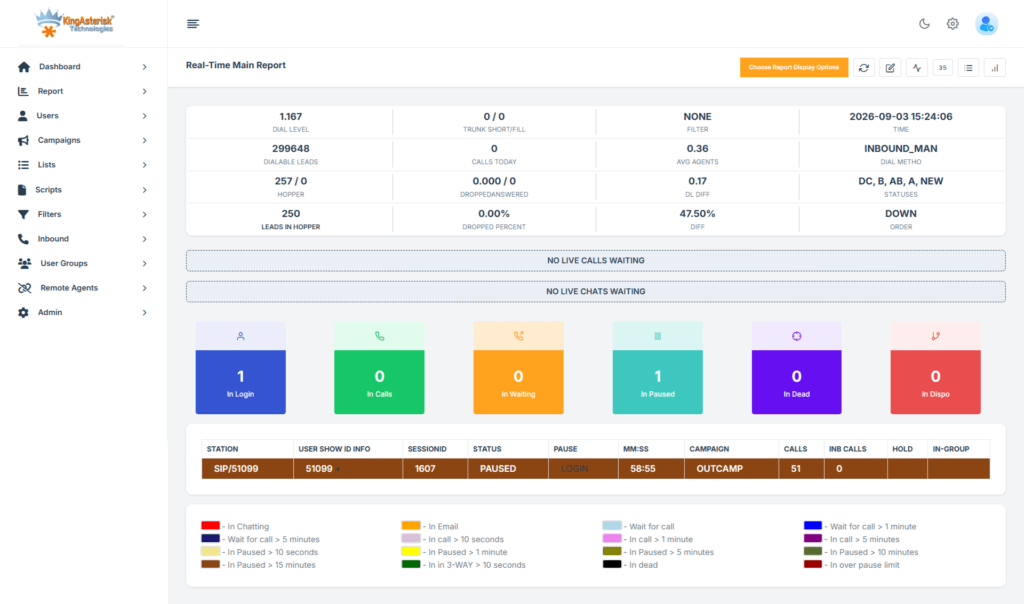
Real-time reports pull directly from VICIdial’s live data tables. Supervisors can see call volume, wait times, answer rates, and drop rates across all campaigns in a single view — no manual report generation required.
Agent state breakdown
Every logged-in agent appears with their current state: INCALL, CLOSER, DISPO, PAUSED, or DEAD. The colour-coded grid makes it immediately obvious if an unusual number of agents are in pause or dispo simultaneously. Supervisors can also see how long each agent has been in their current state, which flags excessive pause time without needing to pull a separate report.
Live queue and campaign stats
Each active campaign shows the number of calls waiting, the average wait time, the current answer rate, and the number of agents assigned. When a VICIdial inbound queue starts building, the waiting call count turns amber and then red based on configurable thresholds. No manual calculation is needed – the threshold logic is built in.
Call volume and drop rate indicators
The dashboard aggregates the total calls answered, calls dropped, and current average handle time across all active campaigns. Drop rate is particularly valuable for outbound operations: a spike in dropped calls often signals a dial ratio issue before it becomes a compliance concern.
Hourly trend bars
A compact bar view shows call volume and answer rates for each hour of the current shift. This lets supervisors see at a glance whether performance is tracking ahead of or behind the same period on the previous day, without opening a separate reporting module.
How the real-time data feed works
VICIdial stores live operational data in a set of MySQL tables – live_inbound_agents, vicidial_live_agents, vicidial_campaigns, and related tables. The supervisor analytics theme queries these tables directly using AJAX calls that fire on a polling interval set in the theme’s configuration file. The default is three seconds, which is usually the right balance between freshness and server load.
For larger deployments running more than 200 concurrent agents, it is worth increasing the polling interval to five or six seconds and adding a read replica for the reporting queries. This prevents the real-time dashboard from adding load to the same database connection pool that handles dialer operations.
The theme does not require WebSockets, which keeps the setup simple. The data is fetched as JSON and rendered client-side. This means even a basic Apache or Nginx web server can serve the theme without any additional back-end infrastructure.
Setting up and customising the theme
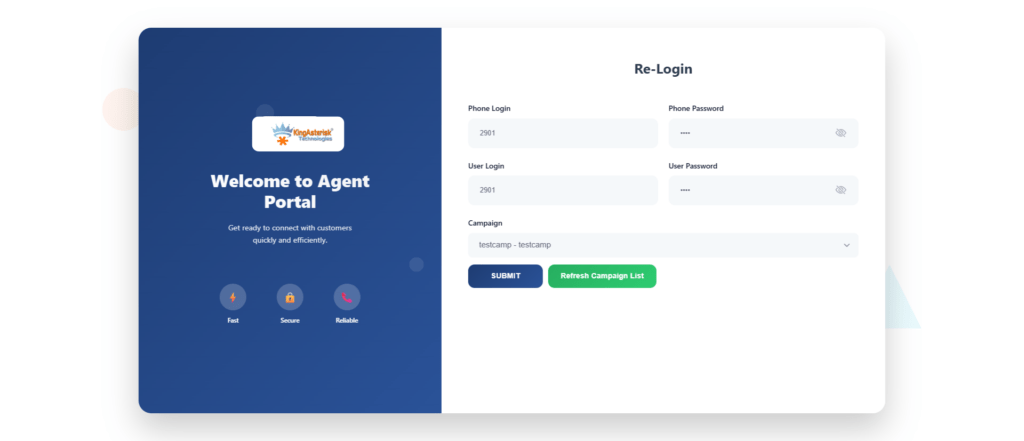
Agents log in through the standard VICIdial agent interface. The supervisor analytics theme runs in parallel, pulling agent state data from VICIdial’s live tables as soon as an agent session is active.
Minimum requirements
The theme runs on any server that already hosts VICIdial. It requires PHP 7.4 or higher, MySQL 5.7 or MariaDB 10.3 or higher, and a web server with mod_rewrite enabled. Browser-side, it works on Chrome, Firefox, and Edge without any plugins.
Installation steps
The theme files sit in a subdirectory of your VICIdial web root, typically /var/www/html/vicidial/supervisor_theme/. The config.php file holds the database credentials, the polling interval, and the campaign filter list. Once configured, the dashboard is accessible at the subdirectory URL and login is handled through VICIdial’s existing session management.
Customisation options
The most commonly adjusted settings are the colour thresholds for queue depth alerts, the list of campaigns displayed, and whether the hourly trend bars show the current day only or a comparison against the prior day. Teams with branded interfaces often update the CSS variables to match their internal tool colour scheme. The theme’s stylesheet uses CSS custom properties throughout, so a brand colour update requires changing fewer than ten lines.
Common mistakes supervisors make without live analytics
The absence of a real-time view leads to a predictable set of problems. Understanding them is useful both for making the case for the theme and for configuring it correctly once deployed.
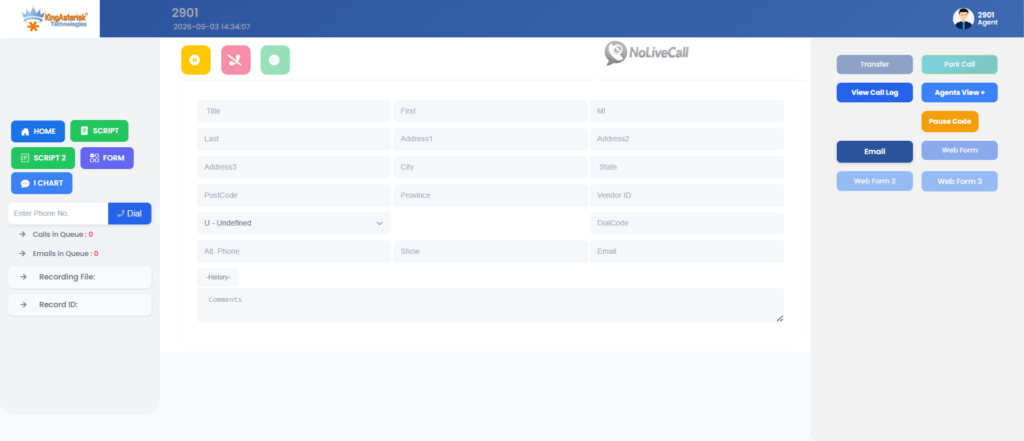
The agent dashboard shows each agent’s current state, time in state, and campaign assignment in real time. Supervisors can spot excessive pause time or dispo lag immediately, without checking each agent individually.
Relying on scheduled reports creates a lag between the event and the response. A drop in answer rate that shows up in a 30-minute report has already been affecting customers for up to 30 minutes.
Manual agent monitoring – supervisors walking the floor or sending internal messages to check agent status – is inconsistent and does not scale beyond small teams.
Without a queue depth view, supervisors cannot distinguish between a slow period and a period where agents are available but callers are not waiting long enough to be answered. These two situations require opposite responses.
Pause time misuse is difficult to catch without a live agent state view. An agent in PAUSED state for 12 minutes looks exactly the same as one in PAUSED for 90 seconds until someone checks – and without the theme, checking requires opening the supervisor panel manually for each agent.
Frequently asked questions
The VICIdial Supervisor Analytics Theme is a real-time dashboard that replaces or supplements the standard VICIdial supervisor screen. It is built for floor supervisors and operations managers who need to monitor agent states, queue depth, and call volume across multiple campaigns simultaneously. It is particularly useful in operations where conditions change quickly during peak periods and delayed reporting creates response lag.
The community version is available on GitHub under the VICIdial open-source project repositories. A production-ready build with additional features – configurable alert thresholds, multi-campaign filtering, and wall-display mode – is available from KingAsterisk. The maintained version includes compatibility updates for recent VICIdial releases and has been deployed across contact centers in multiple regions.
The GitHub community version was originally written for VICIdial 2.12 and 2.13. Some of the database table queries need updating for version 2.14 and above due to changes in the live_inbound_agents schema. Teams running current VICIdial versions should either apply the necessary query updates manually or use a maintained build that has already been adjusted for the current table structure.
The polling interval is configurable in the theme’s config.php file. The default is three seconds, which is suitable for most operations. High-agent-count deployments – over 150 concurrent agents – often benefit from a five-second interval to reduce database query frequency. For operations where sub-second latency matters, a WebSocket-based approach would be needed, which requires custom development beyond the standard theme.
Yes. The campaign filter list in config.php accepts a comma-separated list of VICIdial campaign IDs. Supervisors who manage a subset of campaigns see only those queues and agent states, which reduces visual noise and makes threshold alerts more meaningful. Multiple supervisor accounts can each have different campaign filters if the theme is configured with per-user settings.
Conclusion
The VICIdial Supervisor Analytics Theme solves a specific and common problem: supervisors managing busy operations cannot act on information they do not have. Real-time visibility into agent states, queue depth, drop rates, and hourly trends gives supervisors the context to make staffing decisions in the moment rather than after the fact.
The setup is straightforward for any team already running VICIdial. The community version on GitHub is a good starting point for technical teams, while production deployments benefit from a maintained build that tracks VICIdial version changes. The real-world impact – shorter wait times, fewer dropped calls, faster reassignment of idle agents – comes from making the right data easy to read at a glance.
KingAsterisk has deployed and customized the VICIdial Supervisor Analytics Theme for contact centers across India, Southeast Asia, the United States, and the Middle East. If your operation runs VICIdial and you want to implement or tailor this dashboard for your specific setup, contact the KingAsterisk team for a no-obligation conversation about what would work for your environment.