Key Takeaways
- Cloud Telephony Dashboard Solutions give contact centers a unified, real-time view of all inbound and outbound communication activity across global teams.
- A well-configured dashboard reduces average handle time (AHT), improves first-call resolution (FCR), and increases agent accountability.
- Platforms built on open-source stacks like Asterisk and VICIdial deliver enterprise-grade monitoring without the overhead of proprietary lock-in.
- Effective dashboards integrate IVR routing, call queue visibility, agent status boards, and CRM data into a single pane of glass.
- Businesses that deploy structured telephony dashboards report measurable improvements in supervisor response time and customer satisfaction scores.
Cloud Telephony Dashboard Solutions are centralized interface platforms that aggregate live and historical communication data from telephone systems, IVR engines, and agent workstations into a single, manageable screen. For contact centers handling thousands of calls daily across multiple geographies, these dashboards are not optional, they are the operational backbone that separates reactive management from proactive control.
This article explains exactly what these solutions do, how they are architected, and how contact center managers, IT teams, and business owners can deploy them effectively using platforms like Asterisk and VICIdial. Whether you are running an inbound support desk, an outbound sales floor, or a blended operation, the dashboard layer determines how quickly you can identify bottlenecks, coach agents, and deliver consistent client experiences.
Core Components of an Effective Telephony Dashboard
Not every dashboard is built the same. A genuinely capable telephony dashboard for global operations must include several interdependent modules that work together in real time.
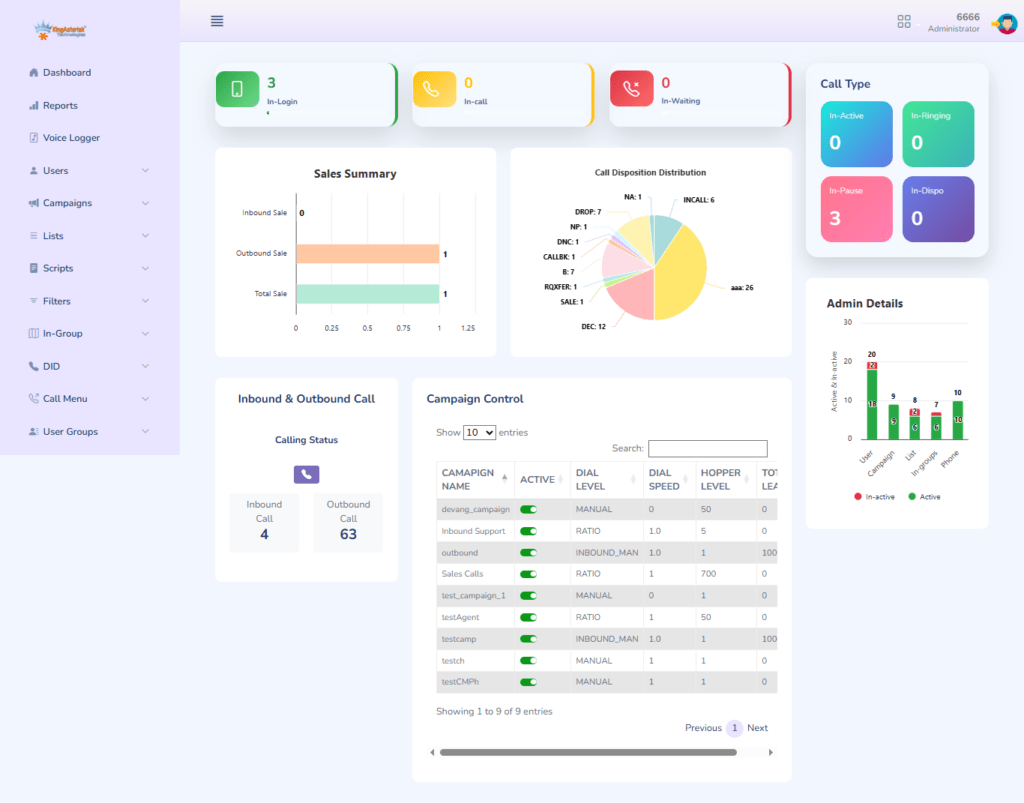
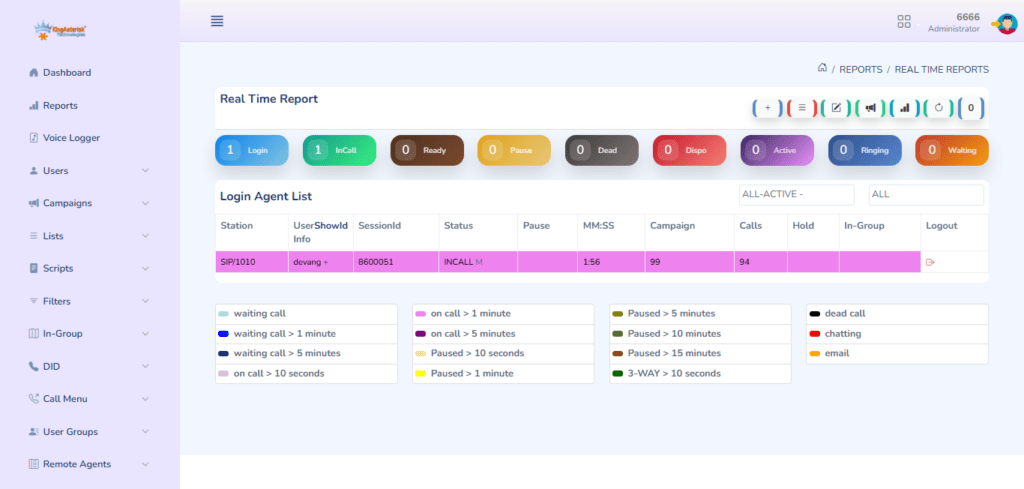
Real-Time Queue Display
The queue panel shows the current state of all inbound call queues: how many callers are waiting, how long they have been waiting, which agents are available, and what the current abandon rate looks like. Without this visibility, supervisors are flying blind.
Agent Status Board
Each agent’s current state: available, on-call, in wrap-up, or away, must be visible at a glance. This feeds directly into workforce management decisions and lets team leads intervene when an agent has been in wrap-up too long or a queue is growing faster than capacity allows.
IVR Flow Visualization
For operations using Interactive Voice Response systems, the dashboard should display how callers are navigating the IVR tree: which menu options are being selected, where drop-offs occur, and how effectively the routing logic is directing traffic to the right skill groups.
Historical Reporting Panel
Supervisors need more than a live view. The historical panel surfaces call volume trends by hour, day, or campaign, giving planning teams the data they need to staff accurately and identify seasonal demand patterns.
Wallboard and Alerting Layer
High-performing contact centers use wallboards, large displays mounted in the operations floor, that pull from the same dashboard data. Alert thresholds can be configured to trigger notifications when service levels breach defined limits.
How a Call Monitoring Dashboard Improves Contact Center Performance
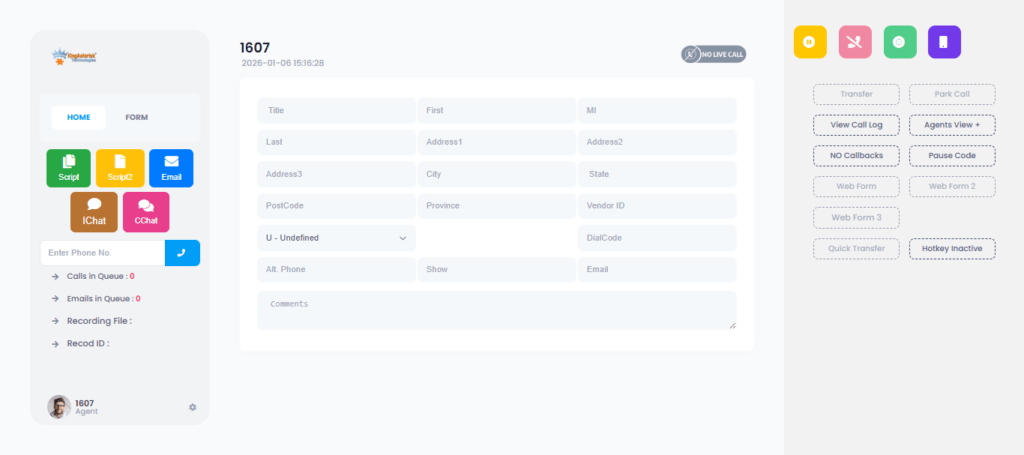
A Call Monitoring Dashboard is the supervisor’s primary tool for quality assurance and real-time intervention. In a properly configured VICIdial or Asterisk environment, the monitoring layer allows supervisors to:
- Listen silently to live calls without the agent or caller being aware
- Whisper-coach agents mid-call, where only the agent hears the supervisor’s guidance
- Barge in to calls where escalation is required and the supervisor needs to speak with the customer directly
These three modes: monitor, whisper, barge, represent the core of real-time quality management. When tied to a dashboard interface, supervisors can trigger any of these modes by clicking directly on a live agent tile rather than manually dialing extension codes.
Beyond live monitoring, the call monitoring dashboard captures recordings linked to each interaction record, making post-call coaching structured and evidence-based rather than anecdotal.
Real-World Use Case: Multi-Site Contact Center Deployment
Consider a financial services company operating contact centers in three countries, India, the Philippines, and South Africa, supporting a European and North American client base. Before deploying a unified telephony dashboard, each site operated its own reporting tools.
Supervisors at the central operations hub had no real-time visibility into what was happening at remote locations. Escalations were handled through email, and performance data was compiled manually each morning.
After deploying an Asterisk-based telephony infrastructure with a centralized dashboard layer, the operations team gained a single view of all three sites simultaneously. Queue depths, agent statuses, and service levels were visible in real time across time zones. The IVR routing logic, which directed callers to the appropriate regional team based on language preference and account type, was also visible through the IVR flow module.
The result was a 22% reduction in escalation handling time and a measurable improvement in first-call resolution rates within the first 90 days. Supervisors could identify when a remote site was under capacity and temporarily redirect overflow traffic to another site, without a single phone call or email between management teams.
This kind of operational coordination is only possible when the telephony dashboard is genuinely integrated across the platform rather than being a bolt-on reporting tool.
Step-by-Step: Setting Up Your Telephony Dashboard
For IT managers and contact center operators deploying or upgrading a telephony dashboard on a VICIdial or Asterisk platform, the process follows a structured sequence. Skipping steps, particularly around data mapping and permission configuration, is the most common cause of dashboard deployments that underdeliver.
Step 1: Define Your Operational KPIs Before touching a configuration screen, list the 8–12 metrics that matter most to your operation. Service level, AHT, abandon rate, and agent occupancy are standard. Add any campaign-specific metrics relevant to your business.
Step 2: Map Your Telephony Architecture Document all trunk groups, DIDs (Direct Inward Dial numbers), queue names, skill groups, and IVR nodes. The dashboard can only surface what is correctly labeled in the underlying telephony configuration.
Step 3: Configure Queue and Agent Integration In VICIdial, ensure that all inbound groups and campaigns are correctly associated with agent login groups. The dashboard’s agent status board pulls directly from these associations.
Step 4: Set Up the Real-Time Data Feed Asterisk exposes call state information through the Asterisk Manager Interface (AMI). Confirm that AMI is enabled, credentials are correctly configured, and that the dashboard application has read access to the relevant event classes (call, agent, queue events).
Step 5: Build Your Wallboard Layout Design the wallboard view for your operations floor. Prioritize the metrics most immediately actionable by supervisors, queue depth, service level, and agents available. Avoid cluttering the display with metrics that require context to interpret.
Step 6: Configure Alerting Thresholds Set threshold-based alerts for service level breaches, long wait times, and high abandon rates. Route alerts to supervisor stations or mobile devices depending on your escalation protocol.
Step 7: Test with Live Traffic Run the dashboard in parallel with your existing reporting for at least two weeks before decommissioning legacy tools. Validate that the data shown matches CDR (Call Detail Record) exports from your telephony platform.
Step 8: Train Supervisors and Team Leads Dashboard adoption fails when supervisors revert to manual methods because they were not trained thoroughly. Invest in structured onboarding for every team lead who will use the monitoring and intervention features.
Step 9: Schedule Regular Configuration Reviews Telephony environments change. New campaigns launch, agent groups restructure, and IVR trees get updated. Build a quarterly review into your operations calendar to ensure the dashboard configuration remains aligned with actual platform architecture.
Choosing the Right Client Dashboard Software
Client Dashboard Software in a contact center context serves a dual purpose: it provides operational teams with the internal performance view described above, and it can also surface a client-facing reporting layer for customers who have contracted your center’s services.
Businesses using the predictive dialing feature inside cloud telephony dashboard solutions can significantly improve agent productivity, reduce idle time, and manage high-volume outbound communication more efficiently.
For outsourced contact centers and BPOs (Business Process Outsourcing operations), the ability to give clients direct access to their own campaign performance data is a significant differentiator.
A well-structured client portal, showing call volumes, resolution rates, and agent productivity for that specific client’s campaigns, builds trust and reduces the overhead of manual reporting.
When evaluating client dashboard software, prioritize:
- Role-based access control: Clients should see only their own campaign data. Internal supervisors need access to cross-campaign views. These permission layers must be configurable without custom development.
- Data refresh rate: Real-time or near-real-time data is table stakes for modern operations. Hourly batch updates are not acceptable for supervisors managing live queues.
- Export and API access: Clients and internal analysts need to pull data into their own tools. Dashboards that lock data inside a proprietary interface create friction and erode value.
- Mobile responsiveness: Operations managers and clients alike access dashboard data from mobile devices. A responsive interface is not a luxury feature.
Frequently Asked Questions
Can a telephony dashboard integrate with CRM platforms and third-party tools❓
Yes. Modern telephony platforms built on Asterisk expose data through APIs and database integrations that allow dashboards to pull in and push out information to CRM systems, ticketing platforms, and workforce management tools. The integration architecture depends on your specific stack, but well-structured VICIdial deployments commonly include native integrations, and custom CRM environments.
How many agents or call volumes can a VICIdial-based dashboard handle before performance degrades❓
VICIdial is architected for high-volume environments and has been deployed in operations handling thousands of concurrent agents across distributed server clusters. Dashboard performance at scale depends more on server architecture and database optimization than on the platform’s inherent limits. KingAsterisk deployments are designed with scalability built in from the initial architecture phase rather than retrofitted after growth creates bottlenecks.
Conclusion
Cloud Telephony Dashboard Solutions are the operational infrastructure that separates high-performing contact centers from those perpetually reacting to problems they could have prevented. From the real-time queue visibility that prevents service level breaches to the agent-level performance displays that reduce the need for manual coaching, a properly deployed dashboard layer transforms telephony data into actionable operational intelligence.
The key takeaways from this guide are clear: effective dashboards must integrate real-time and historical views, support role-based access for both internal teams and external clients, connect to IVR and agent systems at a deep level, and be backed by a telephony infrastructure that is architected for scale from day one.
KingAsterisk has deployed contact center telephony solutions built on Asterisk and VICIdial for global clients across multiple industries. Our team brings hands-on deployment experience to every engagement, from initial architecture design through ongoing platform optimization.
If you are evaluating cloud telephony dashboard solutions options for your contact center or looking to upgrade an existing deployment, contact the KingAsterisk team to discuss your specific operational requirements. We build solutions that work for the scale, complexity, and client demands of your business.