
Key Takeaways
- A VICIdial system lag issue is almost always traceable to one of four root causes: under-resourced servers, untuned MySQL databases, Asterisk misconfiguration, or network congestion.
- MySQL query optimization and regular database maintenance alone can reduce dial latency by 30–60% in high-volume deployments.
- Asterisk real-time settings and correct SIP/PJSIP channel configuration have a direct, measurable impact on slow dialer performance.
- Monitoring tools likehtop,mysqltuner, and Asterisk’s own CLI are essential for isolating the exact source of contact center latency.
- Proactive maintenance: log rotation, database purging, and campaign dial ratio audits, prevents lag from recurring after initial fixes.
A VICIdial system lag issue occurs when the dialer platform fails to respond to agent actions in real time, whether that’s a delayed call connection, sluggish screen-pop loading, frozen campaign controls, or a backend that visibly struggles under concurrent sessions. This article diagnoses the exact causes of slow Vicidial dialer performance and gives you a structured, engineer-tested path to fix it.
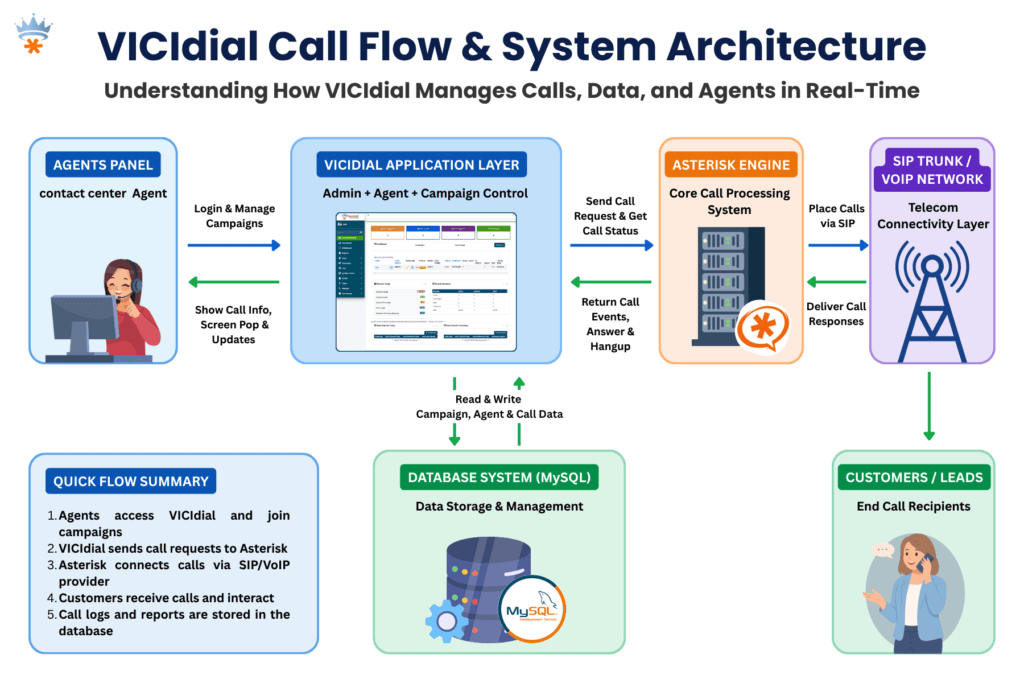
VICIdial is a powerful, open-source predictive dialing platform built on top of Asterisk. When it runs well, it is exceptional. But it is not a plug-and-play system, it requires deliberate server configuration, ongoing database maintenance, and correct telephony stack settings to sustain performance at scale. When any of those layers develops a problem, the resulting contact center latency can cripple agent productivity and erode campaign results.
The good news: virtually every performance degradation scenario I have encountered across 15 years of deployment work has a clear, fixable root cause. Let’s find yours.
Root Causes of Slow Dialer Performance
Before touching any configuration file, understand that slow dialer performance in VICIdial typically originates from one or more of these four layers:
1. Underpowered or Over-Committed Server Resources
VICIdial runs its web interface, Asterisk telephony engine, MySQL database, and campaign manager concurrently on the same server in many single-box deployments. When CPU headroom drops below 15–20%, every layer suffers simultaneously. Swap usage is a death knell, if your system is actively swapping to disk, call handling latency spikes immediately.
2. MySQL Database Bloat and Unoptimized Queries
The asterisk database that VICIdial uses accumulates enormous table sizes over time, particularly in the vicidial_log, vicidial_closer_log, and recording_log tables. Without scheduled archiving and index maintenance, query times that were once milliseconds begin taking seconds. This is the single most common cause of Asterisk performance tuning complaints I receive from contact centers that have been live for 12+ months.
3. Asterisk Misconfiguration
Incorrect settings in sip.conf or pjsip.conf, particularly around qualified timers, registration intervals, and context routing, create unnecessary signaling overhead. A system dialing 200 channels simultaneously with an aggressive qualifying interval of 60 seconds is generating thousands of OPTIONS requests per minute that consume real CPU cycles and Asterisk thread time.
4. Network and Switching Bottlenecks
Packet loss above 0.5% or jitter above 20ms on the path between VICIdial and your SIP carrier causes Asterisk to buffer, retry, and re-negotiate. This manifests as call setup delay, one-way audio stuttering, and agents observing long ring durations before answer. Many operators misattribute this to “dialer lag” when it is a network problem at the transport layer.
Important: Never attempt tuning all four layers simultaneously. Isolate, test, confirm the change, then move to the next. Stacking multiple untested changes makes root cause analysis impossible if performance worsens.
How to Diagnose the Problem
Check Server Resource Utilization
Start with the most immediate view of system health. Run htop or top on your VICIdial server and observe CPU usage per core, memory consumption, and swap activity over a 5-minute window during peak call hours.
Key thresholds:
- CPU: sustained above 80% across all cores, server is resource-starved
- Memory: less than 512 MB free, risk of swap thrashing
- Swap: any active swap usage during production hours is unacceptable for a telephony system
Assess MySQL Performance
Install and run mysqltuner.pl, this script analyzes your running MySQL instance and produces a prioritized list of configuration recommendations specific to your workload. Pay particular attention to innodb_buffer_pool_size, query_cache_size, and table-level statistics for the VICIdial core tables. Check row counts for vicidial_log, anything above 10 million rows without partitioning is a significant performance liability.
Review Asterisk CLI for Errors and Thread Saturation
Connect to the running Asterisk instance with asterisk -r and issue core show channels and core show threads. A healthy system under moderate load will show channel counts proportional to active agents. If thread count is approaching Asterisk’s compiled maximum (maxcalls parameter), call queueing and answer detection delays occur at the platform level.
Network Path Analysis
Use mtr (My Traceroute) to your SIP carrier’s edge server during a live production window. Observe packet loss percentage and worst-case jitter per hop. If you see loss at any hop inside your own network, your switch, firewall, or WAN router, that is your first priority, regardless of any software tuning you plan.
Step-by-Step: Fix VICIdial System Lag Issue
This is the practical resolution sequence I follow when engaging with a new contact center reporting a VICIdial system lag issue. Work through each step before advancing to the next.
Baseline your metrics before touching anything
Record current CPU load average, free memory, swap usage, MySQL slow query count, and a sample agent screen-pop time. You need before/after data to confirm improvement.
Archive and purge oversized MySQL tables
Export vicidial_log records older than 90 days to a separate archive table or external file. Then run OPTIMIZE TABLE vicidial_log; to reclaim fragmented space and rebuild indexes. Repeat for vicidial_closer_log, recording_log, and vicidial_dial_log.
Tune MySQL InnoDB buffer pool
Edit /etc/my.cnf and set innodb_buffer_pool_size to 60–70% of total available RAM. For a server with 16 GB RAM, this means 10–11 GB. Restart MySQL and monitor query execution times, most deployments see immediate reductions in query latency for VICIdial’s real-time reporting tables.
Adjust Asterisk SIP qualify intervals
In sip.conf (or the PJSIP equivalent), set qualifyfreq=120 rather than the default 60. For trunks where endpoint health is managed by your carrier, disable qualify entirely with qualify=no. This can reduce background Asterisk CPU consumption by 10–20% on systems with 20+ registered trunks.
Review and reduce VICIdial real-time refresh intervals
In astguiclient.conf, the variable VD_REFRESH_INTERVAL controls how frequently the agent interface polls the server. Increasing this from the default 1 second to 2–3 seconds on high-agent-count deployments reduces PHP and MySQL load without a meaningful impact on agent experience.
Audit campaign dial ratio settings
An aggressive campaign dial ratio generates more concurrent Asterisk channels than the system can handle gracefully. Review each active campaign’s dial_ratio and auto_dial_level. Temporarily reducing these during peak hours while you complete the other tuning steps prevents the problem from compounding.
Resolve any network packet loss before concluding
If your mtr analysis revealed loss, address it: replace faulty patch cables, update switch firmware, adjust QoS policies to prioritize RTP/SIP traffic, or engage your ISP if loss is occurring at their edge. Software tuning cannot compensate for a leaky network.
Reboot cleanly and re-baseline
After completing all changes, perform a scheduled maintenance reboot. Allow the system to warm up under light load for 30 minutes before re-running your baseline checks. Compare every metric from step 1. Document improvements and outstanding issues for your next maintenance window.
Real-World Use Case: 200-Seat Outbound Contact Center
Real-World Deployment Example
A financial services contact center running 200 outbound agents on a single VICIdial server (32-core, 64 GB RAM) began experiencing severe call setup delays, agents reported 4–6 second gaps between accepting a call and hearing the connected party. Screen-pop data was arriving 3–5 seconds after connection. Campaign managers also noticed the predictive dialer was underpacing against its configured dial ratio.
Our diagnosis revealed three concurrent issues. First, the vicidial_log table had grown to 38 million rows across 30 months of operation with no archiving policy in place. MySQL was spending 800–1,200ms on every real-time report query. Second, the InnoDB buffer pool was configured at the default 128 MB, a setting appropriate for a test environment, not production.
Third, the SIP qualify interval was set to 30 seconds across 48 registered trunks, generating roughly 96 OPTIONS messages per second as constant background noise for Asterisk.
The resolution took a single 4-hour maintenance window. After archiving 28 million log records, setting the buffer pool to 40 GB, increasing qualification frequency to 120 seconds, and optimizing all four primary log tables, screen-pop latency dropped from 3–5 seconds to under 400 milliseconds. Call setup delay normalized to under 1 second. The slow dialer performance was entirely a database and Asterisk configuration problem, the hardware was never the bottleneck.
Advanced Tuning for High-Volume Deployments
Separate MySQL onto a Dedicated Server
For deployments above 150 concurrent agents, the most impactful architectural change is removing MySQL from the VICIdial/Asterisk host and placing it on a dedicated database server.
This eliminates the resource contention between Asterisk’s real-time audio processing and MySQL’s I/O-heavy query execution. A dedicated database server with NVMe storage can reduce query latency by a further 40–60% compared to a co-located spinning disk deployment.
Enable MySQL Slow Query Log During Peak Hours
Temporarily enable the slow query log with a threshold of 1 second to capture the specific queries that are causing delays in your environment. Different deployments accumulate different reporting table sizes, so the slow queries in your system may differ from a reference installation.
# Add to /etc/my.cnf under [mysqld] slow_query_log = 1 slow_query_log_file = /var/log/mysql/slow.log long_query_time = 1 log_queries_not_using_indexes = 1Asterisk Real-Time Performance Settings
Review /etc/asterisk/extconfig.confto ensure only the tables that VICIdial actually requires are loaded via real-time. Unnecessary real-time table lookups add database round trips to every call routing decision. Removing unused real-time mappings is a low-risk, moderate-impact optimization.
Operating System Kernel Tuning
For high-concurrency telephony servers, set the following in /etc/sysctl.conf to increase network socket performance and reduce TIME_WAIT state accumulation:
net.core.rmem_max = 16777216 net.core.wmem_max = 16777216 net.ipv4.tcp_fin_timeout = 15 net.ipv4.tcp_tw_reuse = 1 fs.file-max = 65536Preventing VICIdial Lag from Coming Back
Fixing a VICIdial system lag issue once is straightforward. Keeping it fixed requires proactive operational discipline. These are the maintenance practices that separate well-run contact centers from those that call for emergency support every few months:
- Scheduled log archiving: Set a monthly cron job to move VICIdial log records older than 60 days to an archive table. Keep the working tables lean.
- Weekly OPTIMIZE TABLE runs: Schedule mysqlcheck –optimize during a low-traffic window each week to prevent index fragmentation from accumulating silently.
- Asterisk log rotation: Verbose Asterisk logging fills disk quickly on busy systems. Configure logrotate for /var/log/asterisk/ with a 7-day retention policy.
- Monthly capacity review: Compare current agent count and dial volume against the server resources provisioned at deployment. Contact center growth frequently outpaces the original hardware specification within 12–18 months.
- Quarterly network path testing: Re-run mtr to your carrier edge during production hours quarterly. Network paths change, and a carrier route update can introduce new latency without any action on your part.
Frequently Asked Questions
Q. How do I find out which VICIdial database table is causing the slowdown❓
Enable the MySQL slow query log with a 1-second threshold during peak operating hours. After 30–60 minutes, review the log file for the most frequent offenders. In the majority of deployments, vicidial_log and vicidial_list dominate the slow query output because they grow unchecked without a maintenance policy. Row count combined with the absence of OPTIMIZE TABLE runs is the primary culprit.
Q. Can the campaign dial ratio cause system lag in VICIdial❓
Yes, indirectly but significantly. An excessively high campaign dial ratio generates more concurrent Asterisk channels than the server can sustain cleanly. This doesn’t directly slow the database, but it saturates Asterisk’s thread pool, delays answer supervision processing, and causes the dialer to appear unresponsive. Temporarily lowering dial ratios while performing other tuning steps prevents the issue from masking your improvements.
Q. Is it safe to optimize VICIdial MySQL tables while the system is live❓
Running OPTIMIZE TABLE on large tables like vicidial_log acquires a table lock for the duration of the operation, which can stall real-time queries for several minutes. Always schedule this during a low-traffic or after-hours maintenance window. For systems that cannot tolerate downtime, consider using pt-online-schema-change from Percona Toolkit, which performs the optimization without full table locking.
Q. What is the minimum recommended server specification to avoid VICIdial performance issues at 50 agents❓
For a single-server deployment supporting 50 concurrent agents with predictive dialing, a minimum of 8 physical CPU cores, 32 GB RAM, and SSD-based storage is recommended. InnoDB buffer pool should be set to at least 18–20 GB. Below these thresholds, the system will perform acceptably at low load but degrade noticeably during peak calling hours, particularly when real-time reporting is active alongside live campaigns.
Conclusion
A VICIdial system lag issue is never a mystery, it has a root cause, and that cause is always findable with the right diagnostic approach. In the vast majority of deployments, the path to resolving slow dialer performance runs through MySQL optimization, specifically oversized log tables and an undersized InnoDB buffer pool. Asterisk configuration corrections and network-layer validation complete the picture.
The key discipline is isolation: one change, one measurement, one confirmation before moving forward. Contact centers that attempt to fix everything at once typically cannot tell what worked, which means the problem returns the moment a new variable changes.
Equally important is the transition from reactive fixes to a proactive maintenance culture. Scheduled archiving, weekly table optimization, log rotation, and quarterly capacity reviews will keep your VICIdial platform performing at its best through agent growth, campaign expansion, and the inevitable accumulation of call history data.
At KingAsterisk, our engineers have resolved VICIdial performance issues across dozens of contact center environments, from single-server 20-agent setups to multi-server deployments running 500+ concurrent channels. If your dialer is still lagging after working through this guide, or if you want a professional configuration audit before problems develop, we are ready to help.
Still experiencing VICIdial lag? Let’s fix it together.
KingAsterisk has 15+ years of hands-on VICIdial and Asterisk deployment expertise. Contact our team for a free performance assessment and get your contact center running at full speed.